This is one of my very occasional very long blogs, so I‘ll start with a summary of my argument.
- In recent years a new polling technique, MRP, has attracted much attention. It uses detailed data from large national surveys to predict the results of individual constituencies.
- Despite some well-publicised successes for MRP, I believe there is a systematic flaw in the way it operates. In recent months, MRP surveys have predicted huge Labour majorities and a collapse in the number of Conservative MPs who are likely to keep their seats. In my view, these polls greatly overstate the number of seats the Tories would lose in any general election..
- There are two basic models of swing in elections. The traditional method is uniform national swing (UNS): when a major party suffers a loss in support, it loses broadly the same amount in each seat, regardless of the level of that party’s local support at the previous election. The alternative model is proportional swing: the more votes a party wins locally in one election, the more it risks losing in the next one.
- MRP uses essentially a proportional model. Consider two seats: one where the Tories won 60% at the last election, the other where they won 30%. Under UNS, the party risks losing a similar number of the vote in both seats. Under MRP they are predicted to lose twice as many votes in the first seat as the second. One big effect of this is that when the Government loses a significant chunk of support, proportional MRP polls predict many more seat losses than UNS.
- For some decades, the pattern of swings across Britain has been far closer to UNS than proportional swings. (One dramatic exception is what happened in Scotland in 2015. I discuss this below.)
- However, fresh research, presented below, finds that when governments are in trouble in mid-term, by-elections do produce proportional swings. This new evidence points to a clear, structural difference between the way voters behave in mid-term and the choices they make at general elections.
- This evidence helps to explain why government support almost always recovers, at least to some extent, as a general election draws near. The voters who matter can be divided into two broad groups: grumblers and defectors. Grumblers make their views known in mid-term polls and by-elections. They voted for the Government and wish to register their discontent but not to remove it from office. Defectors determine the outcomes of general elections. They are so disaffected with the government they helped to elect that they want a different party to run the country. So while both groups are responsible for mid-term blues, defectors alone are the voters who bring down governments.
- In recent months, all kinds of last-time Tories have been grumblers, including many the party would regard as fundamentally loyal. Tory MPs with large majorities tend to have more such voters. This is why Conservative losses in by-elections and polls have shown up as big, proportional swings, with huge losses in previously ultra-safe seats.
- Defectors tend to have weaker loyalties – either because they are regular “floating voters” or because events cause them to change their minds about who they want in power. The numbers of defectors tend to vary from general election to general election, but their overall numbers at any one election are generally much the same across different kinds of seat, regardless of whether it is safe Tory, safe Labour or marginal. Hence the shift back from proportional swing to UNS when the whole country chooses a new government.
- Now, grumblers and defectors do not live in fixed groups. The ranks of defectors swell in elections where one of the main parties suffers a big drop in support – such as the Conservatives in 1997 and Labour in 2019. The balance of Tory grumblers and defectors at the next election has still to be determined. But unless there is a fundamental change in voter behaviour (as there was in Scotland in 2015), UNS will provide a better guide to overall seat numbers than proportional swing, as grumblers return to their political homes.
- This also means that Labour’s lead in the polls is likely to narrow as the next election approaches – not necessarily because more voters decide they like the Conservatives after all, but because of the basic difference in voter behaviour between mid-term protest and the moment of choice at a general election.
- MRP could still play a useful role in informing us all of voters’ attitudes as the election approaches, not least in exploring the variations between constituency with different demographic profiles. But I believe it must be done differently, to remove its intrinsic bias towards proportional swing.
- I should add that I have been in touch with the providers of MRP polls and other experienced pollsters in preparing this blog. I should like to thank them for their data and their thoughtful responses, in particular Martin Baxter (Electoral Calculus), Chris Curtis (Opinium), Andrew Cooper (Yonder), Patrick English (YouGov), Chris Hanretty (adviser to Survation), Chris Hopkins (Savanta) and Joe Twyman (Deltapoll). They do not all agree with me or, indeed, each other. However, the pollsters all have an interest in getting the next election right. Let’s see what they do.
Grumblers and defectors
The voters who will decide the next election
Take your pick. A hung parliament? A labour majority of 404, with the Conservatives crashing to just 45 MPs? Polls in the early months of this year have offered both prospects, and a huge variety of election outcomes in between. This analysis seeks to unravel the polls and work out what is really going on. Spoiler alert: unless something astonishing happens between now and election day, a hung parliament is far more likely than a record-breaking landslide.
Along the way, we shall find that there are two distinct types of voters that require our attention: grumblers and defectors. Grumblers are those who complain about their party between elections, but return home when asked to choose who governs them. Defectors are those who become so disaffected that they change their minds about the party they support.
These two groups determine the figures reported by the pollsters and also the outcomes of elections. But they operate differently and help to explain why the polls vary so much, and why mid-term by-elections often exaggerate the movements between political parties. To make life harder for those who dissect polls and elections, the two groups are not fixed. Some grumblers turn into defectors, and vice versa. This analysis examines recent developments in polling that illuminate what is going on – and why we should be wary of the polls that indicate huge Labour majorities.
MRP: beginner’s luck?
The past few years have seen an explosion of polling companies, using a range of polling methods. The most dramatic burst on the scene eight days before the 2017 election. On May 31, the front page of The Times confounded expectations of a comfortable victory for Theresa May. It reported a YouGov survey showing that Britain was heading for a hung parliament. Drawing on a huge sample of more than 50,000, it predicted that the Tories would be down to 310 seats, compared with 257 for Labour and 50 for the SNP. Not only did YouGov get the big story right; its seat numbers were impressively close to the final results for the two main parties (314 and 262 respectively), and overstated the SNP (down to 35 seats) mainly because of a late loss in support in election week.
This was how MRP (Multilevel Regression and Post-stratification) caught our attention. MRP estimates the popularity of parties not just across the country but in each individual constituency. The model requires very large samples in order to do this. This has the advantage of minimising the risk of random sampling error, which can cause results from polls with samples of 1-2,000 to bounce around, even if no change in voter loyalties has taken place.
However, while a huge sample has all kinds of advantages in allowing us to drill down into small demographic groups, its method for converting national votes into numbers of seats is not as reliable that dramatic debut suggests. The reason why other polls, from a range of companies, wrongly projected an outright Tory victory was simple. They all reported significant Conservative leads, ranging from 6 to 12 per cent. Their average, 9 per cent, would indeed have produced a solid Conservative majority.
YouGov’s MRP survey reported a Tory lead of just 3 per cent. This represented a swing of almost 2 per cent to Labour from the 2015 election. A conventional seat projection, based on uniform swing, would also have produced a hung parliament, and very similar figures to YouGov’s MRP model. Its prediction that the Tories would lose their majority was a triumph more for YouGov’s ability to gather a good national sample than for its new way of converting votes into seats.
That said, MRP could proclaim some specific local successes. It showed Labour’s Rosie Duffield with a real chance of gaining Canterbury for the first time ever, overturning a Conservative majority of almost 10,000. She did indeed win the seat, by 187 votes. I have no doubt that MRP can help us to detect which seats are likely to swing more than average, and which less than average. MRP rightly predicted that Canterbury, with its large number of Labour-inclined students, would be one of the seats with above-average swings.
However, as on that first occasion in 2017, the headlines for MRP surveys these days emphasise overall numbers, not individual seats, and this is where the doubts creep in. These doubts are amplified when, as now, the polls report big swings between the two main parties.
Uniform swing versus proportional shifts
One of the great discoveries of David Butler, the giant of election studies, was that when votes shift between parties at an election, they shift by similar amounts regardless of the support for each party at the previous election. To take a notional example, suppose the Tories drop by ten points, from 60 to 50 per cent, in rural Butlershire, then a good guess is that it will also drop by ten points, from 30 to 20 per cent in built-up Butlertown.
At the root of this theory is the proposition that the number of defectors – voters who switch parties – is generally much the same, regardless of whether the seat is safe Labour, safe Conservative, or somewhere in between. As we shall see, grumblers behave differently.
Butler’s insight meant (among other things) that we have needed results from just a few seats to predict the broad shape of the final result. It was this fact that made the swingometer so useful in TV studios on election night. The point is not that votes in every seat will move by the same amount. In any election swings will vary. Rather, Butler’s rule predicted that, for any given national swing, seats that change hands on above-average swings would be broadly balanced by other seats that do NOT change hands because of a below-average swing. So the number of seats that will change hands can be estimated with a fair degree of accuracy, even if the identity of some of the seats is harder to predict.
So successful has Butler’s insight been that its practical application, uniform national swing (UNS), has become embedded in election and polling analysis for more than seven decades. Occasionally it has had to be tweaked (where there has been systematic tactical voting, for example, or where one part of Britain, such as Scotland, behaves differently) but the underlying premise of UNS has held good.
In particular, at election after election UNS has proved far better than its rival theory, proportional swing. Let’s return to our notional examples. Suppose the result from Butlertown comes in first on election night. The Tory vote is down from 30 to 20 per cent. That ten-point drop means that the Conservatives have lost one-third of their support. Should we not expect Tory support in Butlershire also to fall by one-third, from 60 to 40 per cent? This could well mean the Tories losing the seat – which would not happen on a UNS prediction of a ten-point fall from 60 to 50 per cent.
Now imagine that contrast between UNS and proportional swing being repeated across the country at a time when, as now, polls are reporting big falls in Conservative support since the last general election. Proportional swing estimates predict that the higher the Conservative vote at the previous election, the more voters will defect to another party. By definition, the seats that the Tories defend, like Butlershire, contain above average shares of Tory voters. That is why they are Tory seats – and why a national swing against the party, applied proportionally, would lead to more seat losses than UNS estimates.
This is precisely what lies behind recent MRP projections of Labour majorities of up to 400. UNS projections based on the same overall voting intentions produce significantly smaller majorities.
Here is one recent example. In February, Survation’s MRP survey projected Labour securing a record majority of 300. Labour would win 475 seats, the Conservatives 100, the SNP 45 and the Liberal Democrats just five.
Survation’s overall voting intention figures were: Labour 48 per cent, Conservatives 29, Lib Dems 8. If we apply UNS to convert these votes into seats, we have: Labour 409, Conservative 159, SNP 36, Lib Dems 24. Labour’s majority would be 168 – far less than that produced by MRP.
MRP surveys by other companies have produced even larger Labour majorities (up to 404) and even greater Tory catastrophes (down to 45 seats). There is a systemic issue here. If MRP is right, and the days of UNS are over, something dramatic and hugely significant is happening to the way voters behave at general elections. Is that happening?
YouGov’s performance in 2017 leaves the question unanswered, as on that occasion, MRP and UNS produced much the same seat figures. There is a reason for this. MRP and UNS tend to produce similar seat projects when there is a small swing between the main parties. They diverge most in “wave” elections when one of the big parties loses large numbers of voters, as in my notional example above for Butlershire and Butlertown. In that case, as we saw, it matters a lot whether the Tory MP for Butlershire sees her previous 60 per cent vote share fall by ten points (UNS) or 20 points (MRP/proportional).
I do not believe any of the pollsters set out make MRP a proportional-swing model; and, of course, their data produce different swings in different seats, as shown by Canterbury in 2017. The point is that a broadly proportional swing is the consequence, maybe unintended, of the MRP model. Why?
How MRP works
Although the details of the way MRP works are complex, its principle is fairly simple. It divides voters into relatively small demographic groups – gender, age, education, housing, work, income and so on – and gathers data on their political views. It then applies this data to the demographic profile of each parliamentary constituency. If – again, to simplify a complex computer process – it finds that the Conservatives have lost the support of one-third of all women graduates in their 40s working in finance, and that 600 such voters in Butlershire voted Tory at the last election, then it estimates that 200 of them have changed their minds. MRP then adds up all the different groups of voters in the seat and how they would now vote, and predicts that seat’s result in a general election.
Now, the bigger the Tory vote at the last election, the bigger will be most, if not all, of the individual demographic groups – and, therefore, the bigger the overall loss of support. The amount will vary from seat to seat, depending on the precise demographic profile of each one; but overall, the swing against the Conservatives will be roughly proportional to the Tory vote at the previous election.
The effect can be seen from the following data from Britain-wide MRP surveys conducted by four different companies in late 2022 and early 2023 (and my thanks to the companies for sharing their data).

Survation and YouGov also released MRP results for different groups of seats (Survation: England and Wales; YouGov: 88 Con-Lab marginals); the pattern of their figures was much the same.
Now, the idea that the Tories should lose proportionately similar shares of the vote in different seats is not ridiculous. If their national share is down one-third, then it makes intuitive sense that it should fall by one-third in both Barking (27% to 18%: a 9% swing) and Braintree (63 to 42%: a 21% swing).
The problem is that this is not what happens in practice. Butler’s insight remains valid. Taking Britain as a whole, the change in a major party’s vote in any given constituency has seldom correlated with its share of the vote at the previous election. (Two specific exceptions to this rule are discussed below. And, to modify the point slightly, a correlation does kick in for parties that lose votes from a very low base. Plainly, the maximum the Tories can lose in Liverpool Walton is 10% , their share of the local vote there in 2019. But this applies only where the vote-losing party starts off local with well under 30% support. Above 30%, which means every seat it might lose, there is no correlation between vote-share and vote-loss.)
Now, when the national movements are fairly small, the errors in the current MRP process are small. But, as we have seen, when support for one of the main parties is sharply down, rival projections based on the two methods are liable to vary.
Lessons from the 1997 and 2019 landslides
The next election may well be a big-swing, “wave” election. The two such elections in recent history have been 1997 (Tories down from 43 to 31%) and 2019 (Labour down from 41 to 33%).
The results from the 1997 election were analysed in detail by John Curtice and Michael Steed[i]. They found that the loss of Tory support in seats where they had previously won more than 50 per cent of the vote was only slightly greater (12.8 percentages points) than where they had won between one quarter and one-third of the vote (10.6). If the fall had been proportional, the first figure should have been double the second figure. Only where the Tories started off with less than one quarter of the vote, was the swing much smaller.
In 2019, analysis by Professor Chris Hanretty of Royal Holloway, and MRP consultant to Survation, found that “for each extra percentage point Labour won in 2019, it lost around 0.04 percentage points more in 2019. This means that if we’re comparing a seat where Labour won 20% of the vote, to a seat where Labour won 80% of the vote, we’d expect Labour to lose (80 – 20) * 0.04 = 2.4 percentage points more in the seat where they won 80%.” As in 1997, there was a slight gradient, but the overall figures were far closer to UNS than proportional swing, which would have produced an 11-point gulf in the swing between safe Labour and safe Tory seats.
The pattern of swings in the MRP surveys of both YouGov and Survation was significantly closer to proportional than UNS. The larger Labour’s vote share in 2017, the more it was predicted to fall in 2019. Survation detected proportional swings across the board. YouGov’s error was most notable in seats that Labour was defending, where it predicted strongly proportional swings.
The following charts compare YouGov’s MRP projections for Labour seats in its final survey, completed two days before the 2019 general election with the election results in the same seats.
WHAT YOUGOV PREDICTED…

… AND WHAT HAPPENED

As it happens, the scale of Labour losses in the two charts in the area that mattered – seats where Labour had won between 45 and 60 per cent in 2017 – was similar. To that extent, YouGov was lucky again – although this time, it underestimated the Conservative lead. It predicted a Tory majority of just 24. The fact remains that MRP detected a proportional swing in Labour seats that did not in fact happen.
The lesson is clear. Taking Britain as a whole, past general elections have never produced proportional swings. (The analysis above covers two “wave” elections; but analysis of data from other slightly less dramatic change elections, such as 1964, 1970, 1979 and 2010 confirm the point.) The number of deserters – the people who abandon the party they supported last time – normally independent of the political complexion of all but the most one-sided constituencies. Why?
The likeliest explanation can be found in seats with relatively large majorities. The safest Tory seats are dominated by loyal Tory voters; the safest Labour seats by solid Labour supporters – voters who might grumble when they are unhappy with their party’s performance, but stick by it when asked to choose a government. The safer the seat, the more such loyalists and grumblers. (They include people who abstain in by-elections and tell pollsters they “don’t know” which party they back. Currently, polls find a lot of such “don’t knows” who voted Tory last time.) In contrast, the numbers of swing voters, set by seat, who are apt to change their mind as to who should run the country, are much the same, regardless of the local result at the previous election.
To return to our two notional seats, if the national pattern at the next election is a ten-point drop in Conservative, then the 60 per cent who voted Tory last time in Butlershire are likely to divide 50 per cent loyal 10 per cent deserters, while the 30 per last-time Tories in Butlertown are likely to divide 20 per cent loyal 10 per cent deserters. The swing is the same. Hence the persistence of UNS.
The times, are they a-changing?
Now, the fact that something has been true in the past does not necessarily mean it will be the same in the future. Could it be that after many years of broadly UNS elections (again, modified where tactical voting or regional variations alter the pattern), voter-behaviour has changed, suddenly and fundamentally? If so, this is a huge moment for British politics. Decades of theories about electoral behaviour will be overturned. Concepts of swing voters will need to be rethought. Parties will need to revise they way they identify and reach target voters.
Is such a transformation in the way voters behave actually happening?
Martin Baxter of Electoral Calculus has sent me data that raise this very possibility. In an MRP survey earlier this year of 28,000 electors, he also looked at the traditional voting intention responses of 5,000 respondents in 120 safe Conservative seats (share of the vote in 2019 60-plus per cent). On the UNS principle, the swing away from the Tories in these seats should be roughly the same as for Britain as a whole. This what they found for Conservative support:
28,000 respondents across Britain:
2019: 45 per cent; January 2023: 28 per cent. Change: down 17 percentage points
5,000 respondents in safe Conservative seats:
2019: 65 per cent; January 2023: 36 per cent. Change: down 29 percentage points
This seems to vindicate the MRP approach. The Conservatives have lost most votes in the seats where they did best in 2019. On these figures, the Tories really would crash to a catastrophic defeat, and Labour would win by a landslide that would far exceed Tony Blair’s victory in 1997.
So the pollsters have a defence for their recent figures, in that the assumption of proportional swing that underpins their MRP methodology coincides with the current distribution of support when the government is in trouble. As Chris Hanretty put it to me in an email: “We’re not doing an election forecast. We’re doing an estimate of what would counterfactually happen in an election today, without any campaign period, when lots of former Conservative voters would enjoy the luxury of sitting on the fence.”
That’s a fair point. Another way of putting it is that MRPs these days may give us a reasonable idea of what would happen to the Tory vote in any particular seat in a snap by-election. This might be of mild interest to some, but is of limited use in looking forward to the next general election.
More seriously, it’s possible that mid-term MRPs work because their assumption of proportional swing happens to coincide with reality. Here’s the problem. The assumption will still be there in a general election – which means that if the pattern of swings is NOT proportional, and we revert to UNS, MRP risks getting it wrong.
What has happened in past mid-terms past mid-terms
So: what is going on? Have decades of UNS come to end – in which case MRP will be vindicated – or is there a structural difference between the way voters think between elections and the way they behave at elections?
Had pollsters been conducting MRP surveys for many years, we would be able to answer this question. Sadly, they haven’t. What we do have are by-election results. I have been looking at these to see what light they throw on the matter. (It’s possible that someone has already done this research and I haven’t seen it; but to the best of my knowledge, this analysis is new.)
In the past 62 years, the Conservatives have fought 61 by-elections in mid-term by-elections in England when Tory governments have been unpopular. What I have done is calculate the average loss in support within each parliament, and then compare the party’s performance in each election with the relevant average. Thus, in the chart below, the dot furthest to the right represents the Christchurch by-election in 1993. The Tories had won 63.5 per cent of the vote in 1992. In the ten seats the Tories fought in the grim years of the 1992-97 Major administration, the Tories’ share fell on average by 17 percentage points. The fall in Christchurch was 32.1 per cent – 15.1 points worse than the average. So the dot sits at 63.5 on the horizontal x-scale, and minus 15.1 on the vertical y-scale.
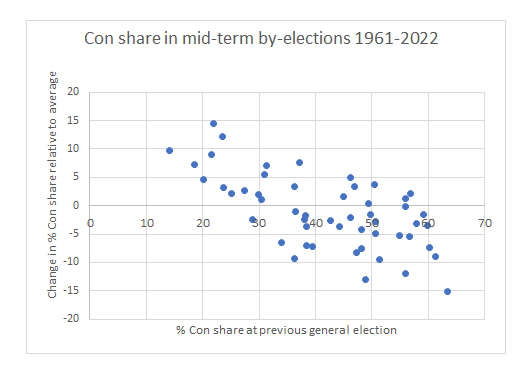
As the chart shows, there is a clear pattern to the results. In general, the better the Conservatives did at the previous election, the more votes they lost at the by-election. The swings away from the Tories were broadly proportional. UNS emphatically did not apply.[ii]
In short, it seems that current polls follow the historic pattern of unpopular government suffering proportional seat-by-seat vote losses in mid-term, only for UNS to reassert itself at the following general election. In both kinds of election, there are exceptions, but the overall pattern is clear and historically stable.
Which brings us back to the grumblers and the defectors. Grumblers influence mid-term attitudes far more than general election votes. They are dissatisfied but not, at least not yet, disloyal. They hope their party will succeed, but want to send a message. A mid-term poll or by-election gives them that very opportunity, for it does not precipitate a change of government. (They include the Tories described by Chris Hanretty who “enjoy the luxury of sitting on the fence”.) Constituencies that supported the government most at the previous election have the most grumblers to lose.
This is why mid-term polls and by-elections produce proportional swings. To be sure, the figures also include defectors – people who have become so disenchanted with the party they helped to put into office that they want a change of government. But grumblers are often the driving force when there is no danger that the opposition will take over at Westminster.
At general elections, grumblers tend to return to the party they supported last time. It’s the defectors who drive the change in votes. However, as we have seen, this reversion to UNS in 2019 was not picked up – or not picked up sufficiently – by MRP surveys.
To repeat: UNS does not imply identical swings in each seat. There are wide variations in the swings of individual seats. In 2019 Leave voting seats in the Brexit referendum swung more to the Tories than Remain-voting seats. Indeed, the great benefit of MRP, properly conducted, is that it can identify which seats are likely to swing more than trend, and which less than trend. It’s the character of the trend that is the problem: at the coming election, assuming some swing away from the Conservatives, will their vote fall more in traditional strongholds, or by broadly similar amounts in all kinds of constituency?
All that said, its worth emphasising the numbers of grumblers and defectors are not fixed for all time. Across Britain, they fluctuate from election to election. In 1997, enough Tory grumblers turned into defectors to give Blair his landslide. But there remained enough solid loyalists, and grumblers returning to the Tory fold, for the Tories’ poll ratings to recover from mid-term levels of support that were even more catastrophic than in the 1997 election and for the pattern of results to be far closer to UNS than to proportional swings.
Exceptions to the rule
There are two glaring recent exceptions to this pattern, both from 2015. They show what happens when the grumbling become so intense that it leads to defections on an epic scale, and a party loses the votes of long-term loyalists who had never previously belonged to the community of floating voters. In 2015, Labour lost all bar one of the 41 Scottish seats it won in 2010. And as the chart below shows, it suffered proportional losses, shedding almost half its support in almost every seat, as the SNP became the country’s dominant party[iii].
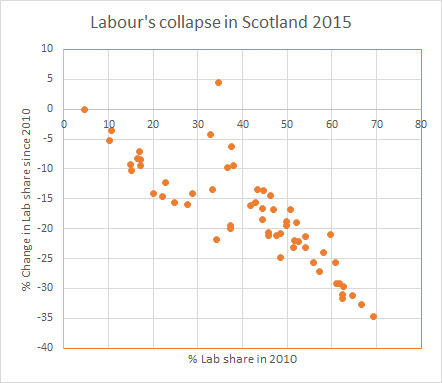
What happened was that historically loyal Labour voters skipped straight to defection, without pausing at the grumbling stage and turning back. The proportional nature of the swing was consistent with a fundamental break with the party, rather than the kind of UNS pendulum swings normally seen at general elections. Labour slumped from 42 per cent support in 2010 to 24 per cent in 2015.
The second example is the Liberal Democrat collapse across Britain in the same election. The higher their vote in 2010, the more they lost in 2015. As with Labour in Scotland, this is what happens when a party is not simply defeated but massacred. It loses not just swing voters but a large slice of its former core support. The higher the previous core vote, the more its vote falls. But such massacres apart, the general story of recent decades is of core voters staying in, or returning to, the fold.
Making sense of the next general election
What does all this mean for MRP at the next general election? As Labour MPs in Scotland, and Lib Dem MPs all over Britain, found to their cost in 2015, UNS does not always work. But otherwise, UNS has so far consistently provided the best guide to the overall national outcome of general elections. When the swing between the two main parties has been small (as in 2017, with its two per cent swing from Conservative to Labour) UNS and proportional swings predict much the same numbers of seats. It is when one of the main parties suffers a big drop in support that the two methods diverge – as the recent MRP example showed above, with the same nationwide vote shares producing a Labour majority 200 seats greater under MRP than UNS.
The fundamental problem with MRP as it has been developed is that it does not discover that swings are proportional; it assumes they are. In mid-terms polls and by-elections, that assumption turns out to be right; but in general elections has historically been wrong. As general elections approach and grumblers return to their political homes, the defectors become the arbiters of Britain’s future, and David Butler’s theory of uniform swing emerges from its mid-term hibernation and comes back to life. If, as seems likely, the Tory vote falls significantly at the coming election, MRP is in danger of getting the result wrong, unless either the pollsters adjust their methods, or there really has been a fundamental shift in the nature of swing at general elections. But if that is the case, then the evidence for this will need to be detected, not assumed.
What should the pollsters do? In researching this analysis, I have been in touch with the main polling companies conducting MRP surveys. They have all been open and generous with their data and their views. They do not all agree completely with me – or each other. However, they are alive to their issues – and plainly do not wish to be caught out at the next election getting their figures badly wrong. (Like pretty well everyone who has done political polls, I have experienced both the pleasure of producing accurate eve-of-election forecasts, and the pain of inaccurate ones.)
I hope they will use their large MRP samples to check for any relationship between past Tory support and current defections. As the election approaches, I expect many Tory grumblers to return to the fold, after their mid-term protests. A lot of them have been telling pollsters they “don’t know” how they would vote. The number is likely to diminish sharply when the time comes to choose the next government. Assuming that the biggest overall shift will still be away from the Conservatives, the key to success will be to estimate the correct relationship betweenf Tory loyalists and defectors in each seat, bearing in mind that the proportions are likely to be different in strong Tory areas than in marginal seats.
(A further challenge for MRP will be the possibility, even likelihood, of widespread tactical voting to unseat the Conservatives. This happened on a significant scale in 1997 – when the Labour and Lib Dem leaders were Tony Blair and Paddy Ashdown, but not in 2019 when they were Jeremy Corbyn and Jo Swinson. Any attempt to estimate constituency results will need to gather evidence of voters’ willingness to vote tactically, bearing in mind that many voters may decide to do so in the final days of the campaign – and large-scale MRP surveys generally need some days for their fieldwork, so might miss part of any late tactical surge.)
Done correctly, MRP has much to offer. Above all, it is the most efficient way to explore the variations in swing around the trend. This was clear in YouGov’s controversial but correct prediction in 2017 that Canterbury would be a knife-edge battle despite having been Conservative or Unionist for 160 years. In 2019, MRP surveys factored in the way people voted in the Brexit referendum three years earlier and correctly identified the risk to Labour in the red wall seats of the Midlands and North. I, and others, predicted the broad scale of Labour’s problem, but MRP provided valuable granular detail. MRP could be a useful tool for following the next general election – provided its current bias towards proportion swing is either removed, or confirmed by decisive new evidence that a revolution in voter behaviour really has taken place and the days of uniform swing are in fact over.
FOOTNOTES
[i] Appendix to The British General Election of 1997 by David Butler and Dennis Kavanagh, p 302.
[ii] The pattern for Labour’s by-election vote losses in Labour-mid-terms is also broadly proportional, though with slightly more outliers. In April 1977, by-elections were held on the same day in Ashfield, where Labour was defending a majority of almost 23,000, and Grimsby, previous majority less than 7,000. Ashfield declared first: the Tories won. In the BBC studio, it was confidently predicted that Grimsby would also change hands. Instead, Labour just held on. It is surely healthy for democracy, and salutary for number-crunchers, that local behaviour does not always follow national rules.
[iii] The only Scottish seat Labour held was the only one that saw its vote share rise: Edinburgh South. Ian Murray had narrowly defeated the Lib Dems in 2010. In 2015, Lib Dem support collapsed; it looks as if the large number of Labour supporters who switched to the SNP was offset by the number of Lib Dems who switched to Labour.
