Be prepared. Next weekend each party will be trying to persuade us that they have done better than expected in Thursday’s elections, and are on their way to victory (Labour), recovery (Conservatives) or breakthrough (Liberal Democrats and Greens). The supporters of each will want to believe the spin. Some may actually do so. This blog offers a shield against the poison-tipped arrows of partisan desire.
The most immediate impact of the results will be on the Tories. Will they do so badly that their MPs try to depose Rishi Sunak? They are defending almost 1000 council seats. Colin Rallings and Michael Thrasher, Britain’s leading experts on local elections, reckon they could lose half of these. Robert Hayward, a Conservative peer with a well-deserved reputation for analysing election numbers objectively, puts the figure at 400-plus. Either would be bad for the Tories. More than 500 would be terrible. But would it be fatal?
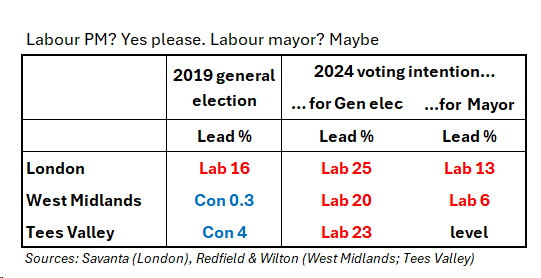
Here is my prediction of what Sunak’s allies will say: “In three big mayoral contests, we have gained ground in recent weeks and shown that effective campaigning can produce impressive results. In London, we have done better than at the last general election; in the West Midlands and Tees Valley, the swing to Labour has been nothing like enough to make Keir Starmer prime minister.”
All that would be true if the results match recent polls. But these polls tell us something else, which the Tories will omit from their public post mortem. What we discover is that many more want a Conservative Mayor than a Conservative Prime Minister (or, at least, than Sunak).
In all three areas, Labour has a big lead when it comes to choosing the next government. This Thursday’s results should be interpreted with care. The pro-Sunak interpretation is that they demonstrate the impact of effective campaigning. His opponents could argue that Sunak is holding his party back. Maybe both things are true.
Unless Labour proves the mayoral polls wrong, its weekend claims will concentrate on the more conventional council elections. The last time all these places held elections as in 2021. The total council tally was very close: Con 985, Lab 965. Hayward expects Labour to gain 200-250. If he is right about both main parties, the new totals will be around Con 600, Lab 1200. From level-pegging to two-to-one would be impressive; a bigger margin would undoubtedly give Labour bragging rights.
However, it’s likely that some of Labour’s gains will be offset by local losses compared with 2021, as former Labour councillors left the party, mainly over Gaza, and are now defending their wards as independents. If Labour can limit these losses to 20-30, it will be relieved; if they approach 100, this would be worrying.
Hayward expects the Liberal Democrats to gain around 100, and the Greens 30-plus – consolidating the gains they have made in recent years. These are useful yardsticks for deciding whether the two parties have under- or overperformed.
How, then, should we judge the overall results and test the rival claims the parties will make? Sometime on Friday afternoon, John Curtice will pop up on BBC television to give the projected national share of the vote for each party. This estimate will take the support for each party in the areas holding elections, and compare these with the results in the same areas in the 2019 general election. It assumes that the ups and downs for each party since 2019 in these areas would match the ups and downs across the country. These are the projected national vote shares in each round of local elections since 2017. (None were held in 2020 because of Covid)

Once again, some care should be taken with these data. There are no local elections this year in Wales or Scotland – or, indeed, much of England. And past local elections can be poor indicators of subsequent general elections. In 2017, the Conservatives went on to lose their majority in parliament five weeks after trouncing Labour in the local elections. In May 2019, the Tories were struggling – yet went on to secure an 80-seat Commons majority later in the year.
However, in both cases, the political weather changed dramatically after the local elections: in 2017 Theresa May’s election campaign was upended by her policy on social care; in 2019, Boris Johnson replaced May as Prime Minister. So, treated with care, these national projections do give a reasonable picture of the national mood at the time.
The best thing is to compare like-with-like. Twelve months ago, Labour enjoyed the national equivalent of a nine-point lead (Lab 35%, Con 26%). If this changes significantly either way this week, this will matter. A narrower gap, along with mayoral disappointments, would bear out the caution advised privately by some in Starmer’s camp. A bigger Labour lead would be bad for Sunak, regardless of how well the Tories do in the West Midlands and Tees Valley.
The BBC figures will also be the best way to judge the performance of the Liberal Democrats. In the past five years, their projected national share has hovered at 17-20 per cent. This has been roughly double their nationwide polling average – but this is what happens almost always in local elections. Plenty of voters choose the Lib Dems for their council but not for Parliament. Can they exceed 20 per cent this week?
Observant readers will have noticed no mention of Reform in this blog. This is because they are fighting few council seats. The best test of their support will be in the Blackpool South parliamentary by-election, which is also being held this week. In recent times, Reform’s predecessor parties achieved above-average votes in this seat – Ukip won 17 per cent in 2015, the Brexit Party 6 per cent in 2019. Labour is likely to gain the seat from the Conservatives. The two things to look for will be the size of Labour’s majority (3,000 OK; 5,000-plus a triumph) – and how far Reform eats into the Tory vote.
Footnote for nerds. I have cited the BBC national projections because we shall get these on Friday. Next Sunday, Rallings and Thrasher will publish their calculations in the Sunday Times. They use a slightly different method to do the sums. Their estimate for last year was Labour 36 per cent, Conservative 29. As their figure for the Conservatives was three points higher than that given by the BBC, anyone next week looking at national vote shares should compare like-with-like: sticking either with the BBC or with Rallings and Thrasher for both last year and this year.
This blog was first published by Prospect
